|
A series of artworks based on monitoring city spaces. The results are visualisations and sonifications of environmental data made using my own wireless sensor networks 2004- 2009
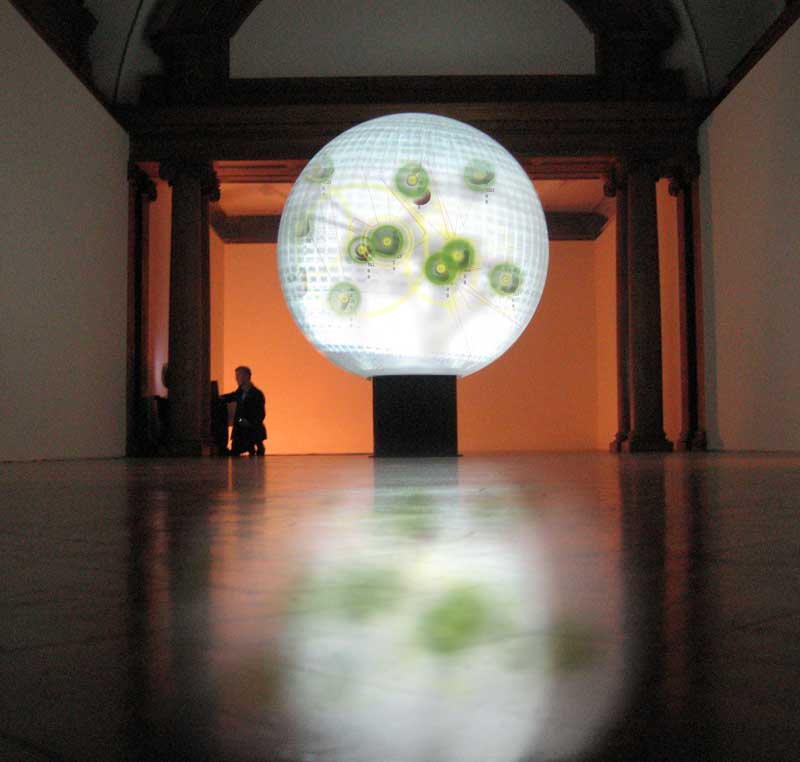
Sensity on a round globe display tested at County Hall London 2006
Live working examples have been made in the cities below. |
|
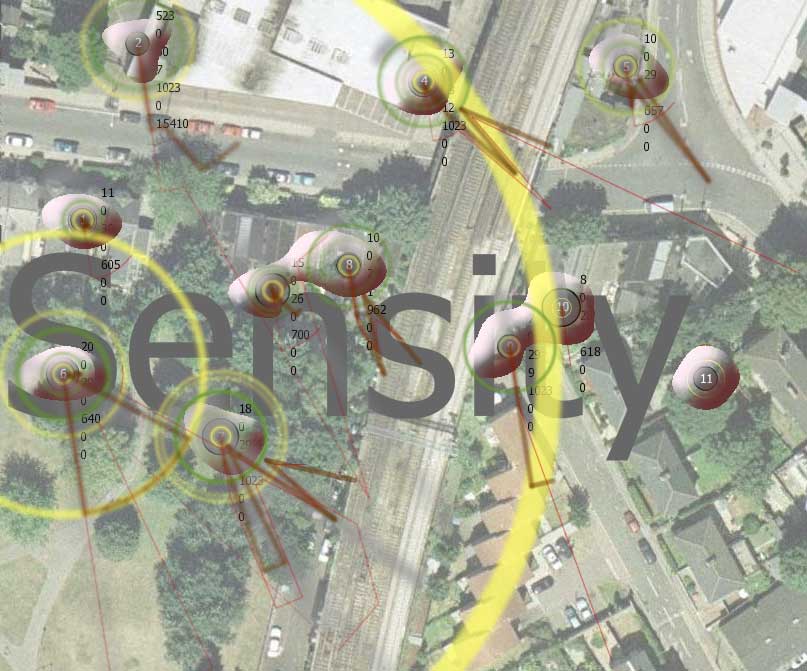
Sensity Brixton London 2004
This artwork visualizes the dynamic data around where I live. I live nearby a railway line, a factory, some trees and a mobile phone mast. (This is using real data).
The city is made up of bits of data that change. This artwork captures this invisible change to try to understand the underlying fabric of city space.
The digital artwork monitors the environment for change and relays these changes via the sensors to the screen you see.
(loci) 1 law an exact place or location, especially one where some incident has taken place.
Click on image for visualization |
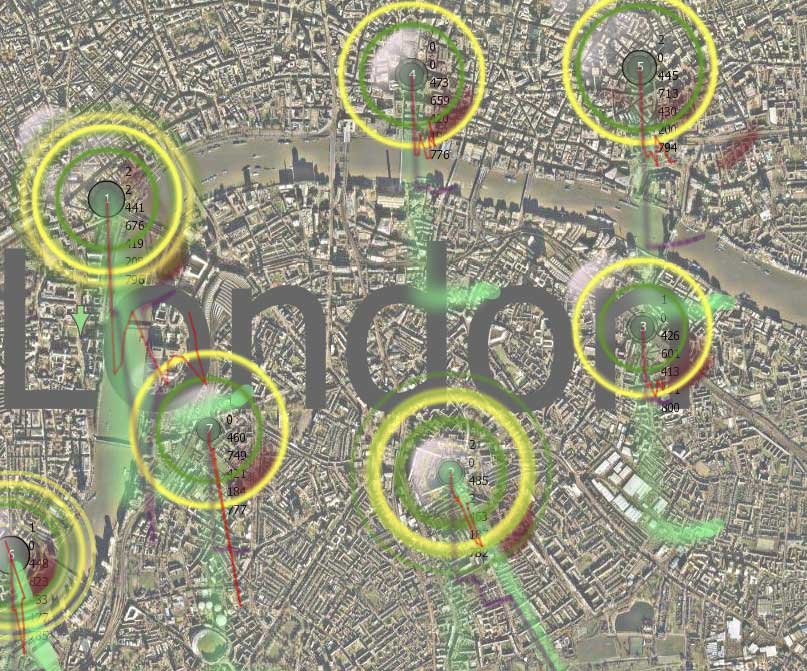 |
Sensity Global London 2006
Sensity involves collecting data across the city of London which visualized to make art. The whole world is a dynamic real time artwork. The city data space becomes mirrored online and the environment becomes an emergent series generative artworks. This is what it will look like when it is rolled out across the city wide environment. (This is using data collected around the river thames).
Click on image for visualization |
|
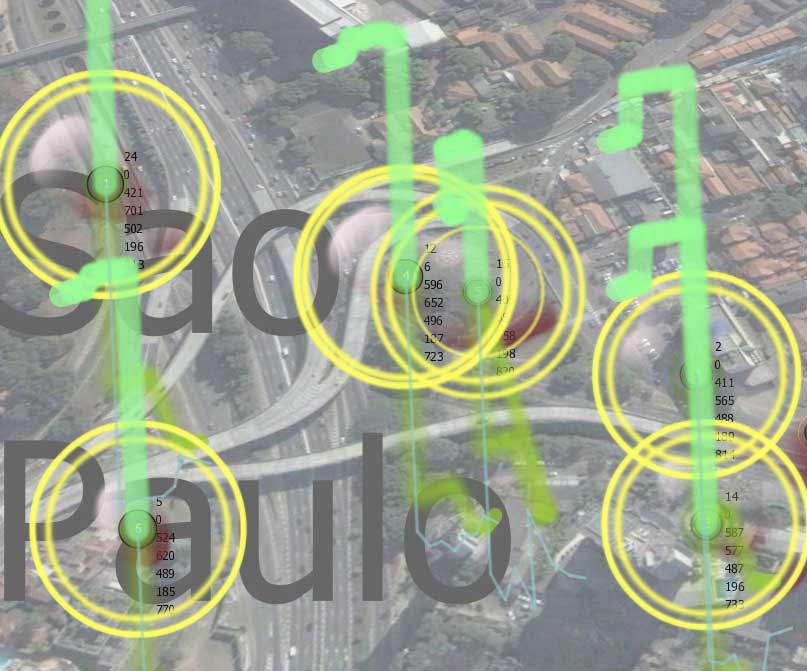
Sensity, Sao Paulo 2007
I took a sensor kit with me to Sao Paulo and made a new version of Sensity from the area around the exhibition space. This road network is nearby as you can see from the map. The exhibition is at Largo Senador Raul Cardoso, 207 , Sau Paulo Brazil. Motomix, Sao Paulo, Brazil. (27-11 / 04-12) 2007. Specially made Sao Paulo version. Two versions were made. This online local version and a real time version.
I went to Sao Paulo to collect the data. Sensors data and sound recordings were taken while I was in Brazil. The stream sounds version takes sounds from Sao Paulo that are on my www.soundcities.com database.
The sounds change as the live sensor data changes. Thanks to the team who helped collect the data and record some sounds with me in Sao Paulo. Curated in Brazil by Fernando Velazquez. Documentation of this exhibition below.
Another version using real time sounds. (NB. takes a while to download data stream) |
|
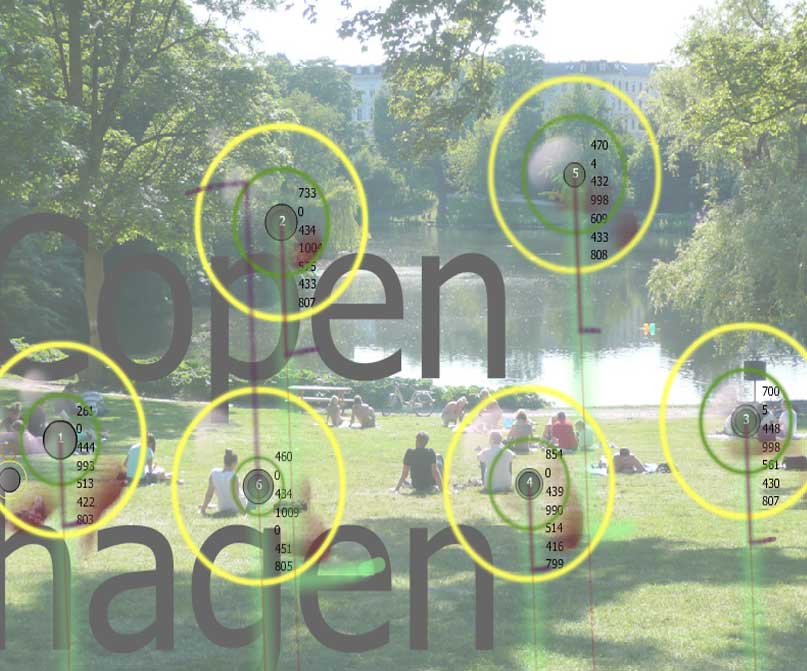
Sensity, Copenhagen déjeuner sur l'herbe" 2007
Inspired by the famous Manet painting of 1863.
I set up a wireless sensor network around a park in Copenhagen, Denmark. The sounds and experiences and changes of the atmosphere and environment are represented in this work.
A representation of the data space as experience.
Click on image for visualisation
ALSO exhibited ten years later.
Warehouse 9 Copenhagen, Denmark. 2017 |
|
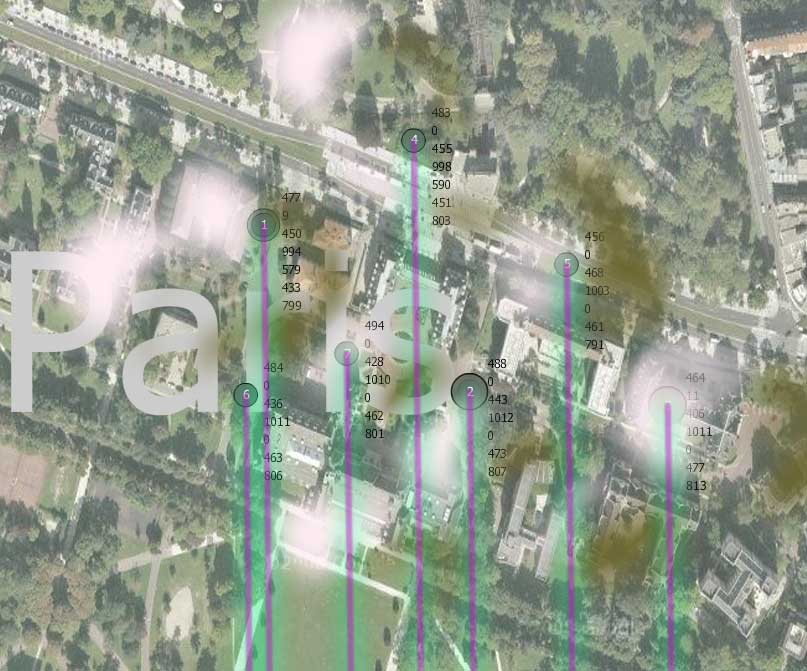
Sensity, Paris. 2007
I have been invited to present and exhibit at Smart City Paris. The event took place in the 'Salon Honnorat', Cité internationale universitaire de Paris 17, bd. Jourdan. 75014 Paris.
I took a six mote sensors with me and made this version of Paris.
The sounds are streaming from the soundcities database and are triggered my sensor activity.
Click on image for visualisation |
|
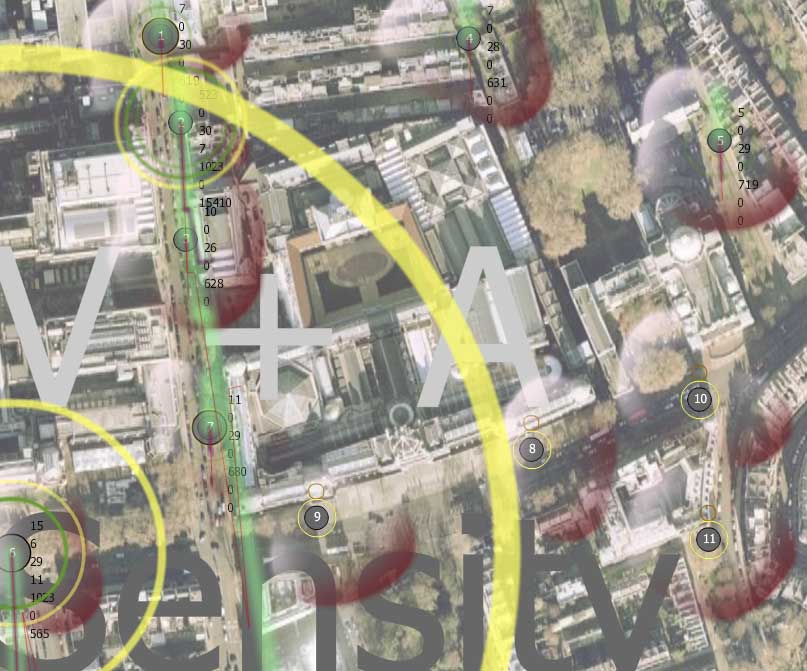
Sensity, V and A London 2008
Victoria and Albert Museum, London.
On 26 Oct 2008, I visited the area around the Victoria and Albert Museum, London.
I hid my sensors around the gallery and made this work of the environment over a few hours in the afternoon. This visualization is made for Cybersonica late at V @ A on 31 st October 2008 and open evening. "Sensity V and A", was installed in the main foyer entrance. Sensity leverages the real time data city and represents it online, showing the properties of the system and the emerging changing behaviors of space.
Images below of how it looked in the Victoria and Albert Museum, London.
No longer Online (5.5.2020) |
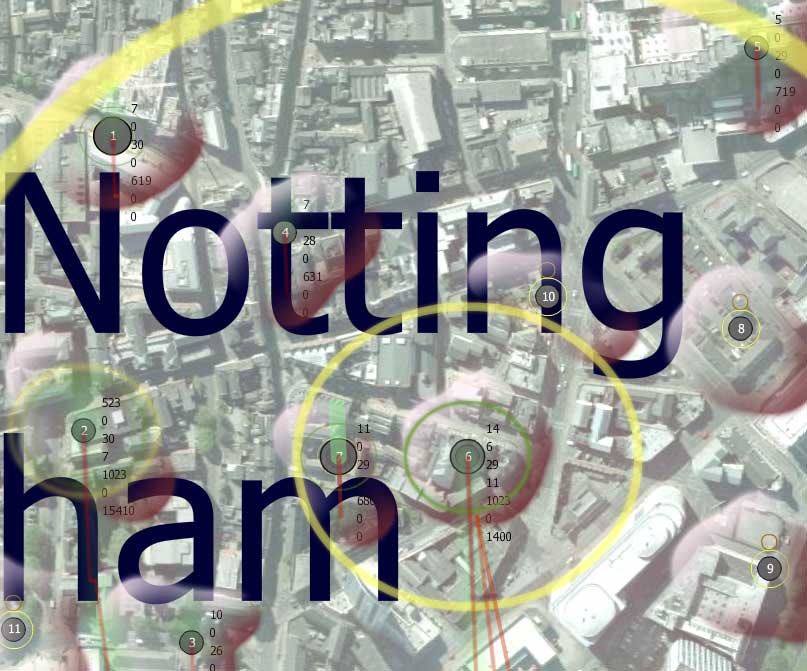 |
Sensity Nottingham 2009
I am in Nottingham making Sensity Nottingham around the Broadway cinema for the Radiator Festival "Exploits in the Wireless City". quoted: "We believe that artists have something different to say about the use of networked urban space. So. we have opened up a space in the busy city to place them side by side with experts whose judgments are sought in changing the cityscape".
For Radiator, Stanza will make a data visualization of Nottingham city using wireless sensor technologies.This is the first version using local data. A real time archived version will appear later.
I am also showing some new images from "Stars Of CCTV" series at The Surface Gallery.
I am also giving a talk on Friday 16thJan 2009 at 3.30 in the Broadway cinema Nottingham.
Click on image for visualisation |
|
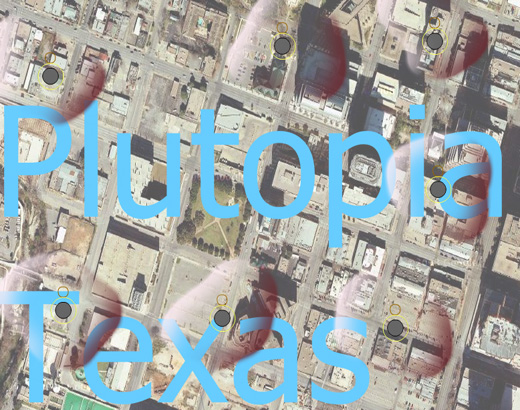
Sensity Plutopia Texas 2009
I was in texas. Plutopia 2009.
Thanks to Derek Woodgate
The 9th Annual EFF-Austin SXSW After Party“Plutopia! – Best SXSW Interactive party to date” – Monday, March 16, 2009
6pm - midnight. Palmer Events Center 900 Barton Springs Road, Austin, Texas 78704
http://plutopia.org/2009/03/uncategorized/stanza-sxswi-plutopia-event/
Stanza will showcase over the evening selected works including:
Sensity – Diversity – Nanocities - Biocities.
Four pieces of generative artworks will be shown over the evening as installations in the space and the artists will be present.
Click on image for visualisation |
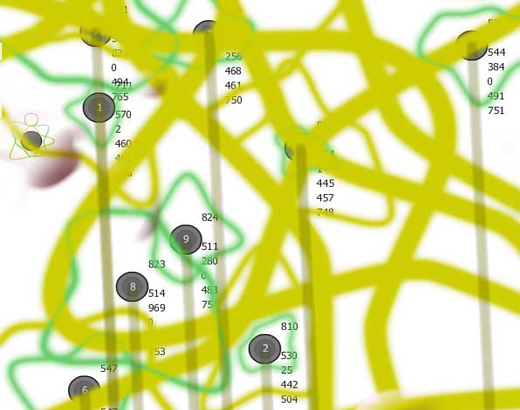 |
Decode at V & A. Sensity V & A 2009 by Stanza. Sensing the city and the environment to make art. The results are the visualisation and sonification of real time spaces.
Using custom made sensors in the V & A Porter gallery and around the city. 20 custom environmental sensors units measure, light, noise, sound, humidity, and temperature....this data is turned into a online real time visualisation of the space.
Stanza’s work “Sensity V & A” uses environmental sensors scattered all over the museum and the city to make visualisation and sonifications. Literally painting with data these works open up a discourse about networks and surveillance technologies. The ownership and interrogation of public domain space is opened out where anyone can view all the data in these networks. This is used by stanza to make artworks but it is of equal interest to urban designers, city planners, and architects. Stanza’s main point is to question the social political fabric of the landscape around us. This work aim to reclaim the city which is remade as a real time virtualised space belonging to all. The work is interactive, real time and responsive; it is also available online.
Decode at V & A
http://www.soundcities.com/va/ |
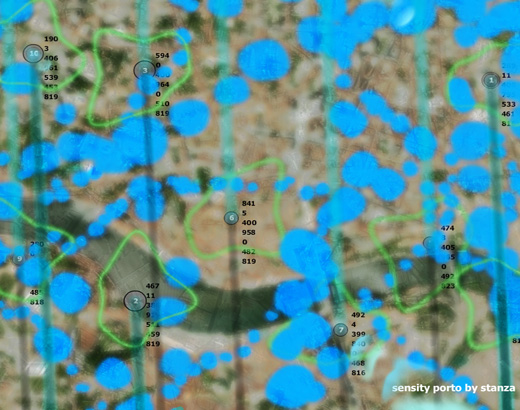 |
Sensity Porto 2010
Sensity Porto For Future Places 2010. I was invited to go and talk and exhibit Sensity in Portugal
Sensing Porto senses the environment to make live visualisation and sonification of the city of Porto. Made using custom made sensors to measure, light, noise, sound, humidity, and temperature....this data is turned into a real time visualisation of the space which was exhibited. The sensors where laid out across the city to take a snapshot of one day in the life of the city.
|
TECHNICAL NOTE.
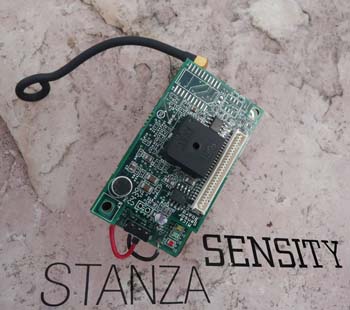
I now have another sensor kit with twenty nodes that can be placed up to 300 meters apart with GPS.
I have made two versions of the Sensity interface software.
One works with recorded data (ie, a sampled junk of time) and one that works with the real time data (ie ever present always changing), which means the sensors are switched on always and working through a router. This uses custom written java based mote proxy software now in version 1.6.
NOTE: The changing data is what affects what you see and experience. The flash interfaces reflecting these real time changes in the interactive city space.
Live XML feeds form real time sensors when switched on. This is open source so other academics, urban designers, researchers as well as artists can make use of the data.
The sensors can monitor temperature, sounds, noise, light, vibration, humidity, and gps.
The sensor network takes a constant stream of data which is published onto an online environment where each different interface makes representations of the XML
From this lots of artistic interpretations can be imagined and made these above example are some in this series.
motes/mts310/
motes/mts420/motestatusxml

|
READ ME: TOURING
Sensity is part of "The Emergent City" series of works by Stanza.
Artworks monitoring the real time interactive city using wireless sensors.
If you are interested in exhibiting this artwork get in touch. I am available to visit your city to take data readings, and make a piece of artwork.
Please note that the artwork is developing and changing all the time.
Sensity can be shown in various ways and stages and outputs.
1. You can also invite me to make a Sensity version in your city in which case I can bring the sensors with me, and make a visualization of your environment.
2. Sensity can then be shown / exhibited as an installation and projected ie, making a display based on the net based interfaces using the data collected.
3. Sensity can be shown / exhibited as an installation on the sphere, but this depends on your budget.
4. Sensity can also installed permanently or for a longer period in rural or urban space, depending on your budget.
5. I am available to give talks on this work.
6. You can fund the next development of my research and artworks which includes:-
a) A physical environment a city, called "The Emergent City".
b) A music system based on changing data all over the city now called Sonicity, its a different project.
c) Performative system using real time gps for 12 players and also for robots called Robotica 6.
Contact: Stanza@sublime.net
|
BOOKINGS
The way Sensity is exhibited is scalable.
I now have several developmental versions of this artwork, and it can be exhibited and experienced to suit your space and budgets.
A. Sensity V1. A localised version this can be made and then projected and also shown online as a data visualisation. I have already made versions for several cities. In this case I test and deploy my sensors generate the data from a 24 hour period and make the visualization which is online and this can then be projected.
B. Sensity V1 Real time. Making it real time
of your city so sensor data isn't recorded but real time. This involves set up of my sensor technology, adding some code to your router, using my sensors, using my computers, set up of the sensors in the correct location, programming them, replacing batteries and care for the duration of the show and insurance. In this case I test and deploy my sensors and make the visualisation and leave the sensors and the computers running.
C. Sensity V2. Make a completely new data visualisation for ie Sensity V2 using new technologies. This involves coding and creating a whole new unique and customised piece for your event and taking the whole project to a next level, possibly more immersive.
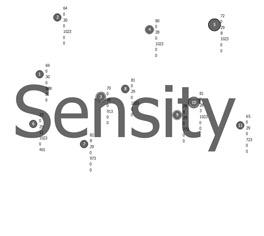
Which ever version above is chosen the final outcome then needs to be displayed or presented. It can be experienced (a) projected .....or shown on (b) 3d globe. Note the cost and set up of the 3d display globe is extra. Let me know.
|
EXHIBITIONS
Sensity Copenhagen,Warehouse 9 Denmark. 2017
Sensity Porto For Future Places 2010
Sensity V & A at Decode show. 2009 - 2010
Sensity Pace Digital New York. 2010
Sensity @Plutopia SXSW Texas. 2009
Radiator Festival and Exhibition Nottingham 2009. "Exploits in the Wireless City".
Biennale of Sydney Revolutions – Forms That Turn 2008
V & A Museum. 2008. Around the gallery.
Smart City Paris. the 'Salon Honnorat', Cité internationale universitaire de Paris 17, bd. Jourdan. 75014 Paris. 31 october 2008.
Motomix, Sao Paulo, Brazil. 2007. Custom made Sao Paulo version.
NIME New York City. USA. 2007.
Share IT in Italy 2007.
Dislocate. Koiwa Art Space Tokyo Japan. 2007.
Presented at Force of Metadata Conference at Goldsmiths college. 2008
Stanza is an independent UK based artist.
|
Datacities. Connecting the city. (2004 - 2009)
A series of artworks based on sensing the environment.
The art of environmental data
Sensity artworks are made from the data that is collected across the city. The sensors interpret the micro-data of the interactive city or responding city space. The outputs from the sensors networks then display a poetic interpretation of the city online, in real time. The information is also used to create offline installations and sculptural artworks. Several artworks (sonfications and visualisations) have been made connecting up space and cities.
All the artworks in this series use data from the real time environment which is collected via a network of custom sensors. A new experience of the city results of the mashed up data from these multiple data streams. Sensity leverages this data and represents it showing the life of the system, while also opening up the control of the system, and the publishing emerging changing bahaviours of the space.
As all things becomes connected and networked, my concept will be become a system that senses not just the city but the whole world. Eventually sensors will be linked to give a real time global visualization. Public domain data resource for art and environmental monitoring.
The sensor network can be moved from urban to rural setting, (they are mobile) and different types of visualization can be made depending on the environment. Sensity is an open social sculpture that informs the world and creates new meaningful experiences.
Sensity is also a highly technical project that gives vast amounts of information about the fabric of our cities. By embedding the sensors like this we can re-engage with the urban fabric and enable new artistic metaphors within city space.
The Poetry of Data
These artworks in the sensity series represent the environment, ie pollution in the air, the vibrations, and sounds and noise of buildings. The sense city is a city full of accumulated incidents; of love, abuse and death, and fundamentally of change. The micro incidents of change in the weather, the noise traffic flows and people flows are all potential sources for inquiry. They are in effect emergent social sculptures visualizing the emotional state of the city.
Open Hardware
Custom made software now enables these sensors to communicate will one another in a network over a proxy server in real time. Control to the hardware is opened up. The data is also used to create visualizations in an open source environment. Other online users can also re- interpret the data and interrogate the various sensors in the network as this is open source as well (see xml streams). Representations of these data sets will allow unique understanding of the urban environment and environment in real time. Motes are used to collect the data. The 'motes' are tiny wireless sensor boards that gather data and communicate to the central server. The real world is monitored and the data stored in my archive retrieval system. Motes and sensor boards sense the micro incidents of change in the weather, the noise traffic flows and people flows. The interactions of all this data, controlled via bespoke interfaces re-form and re-contextualise experiences in real time.
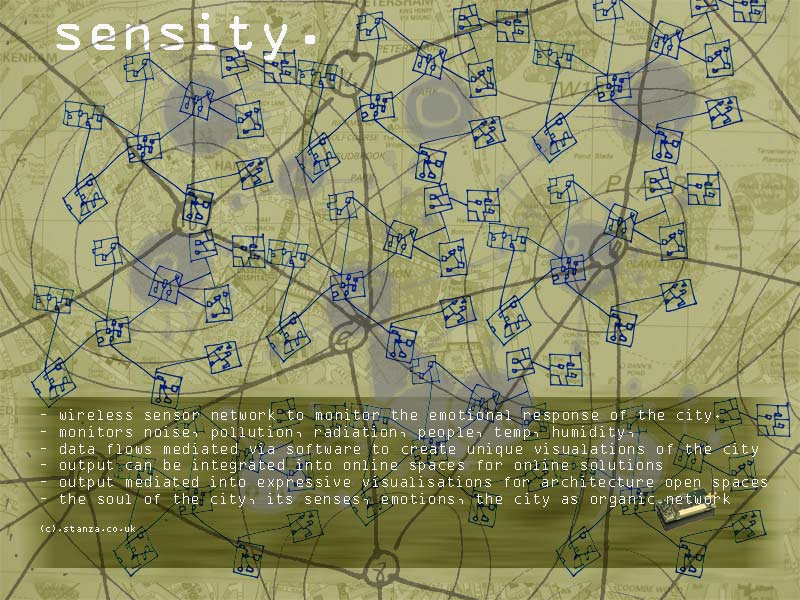
Urban re-mediated experience - audiovisual, mobile and network media in the production, consumption, dataveillance, and experience of places.
Sketch 2004
Version (02) screen shots of online interface visualisation of the real time city. 2004
Sensity Brixton Local version. 2004
The Interactive City.
New metaphors relevant to the experience of the city.
Various types of data can be re-imagined within the context of city space and the environment. This includes pollution data recorded via sensors in the street, to create audio acoustic files expressing the pain and suffering of the air as it pollutes. Weather and forecast data, acquired via weather station equipment; this can be used and can create ambient soundscapes and morphing visualizations as the wind shifts direction or the rain increases. Noise monitor levels, and noise maps , create a symphony of true urban sounds that can be used to make sound reactive sculptures. The patterns we make, the forces we weave, are all being networked into retrievable data structures that can be re-imagined and sourced for information. These patterns all disclose new ways of seeing the world.
The value of information
The value of information will be a new currency as power change. The central issue that will develop will be the privilege and access to these data sources. By allowing access to the (MY) system, I am opening up the control and trying to enable a system of trust.
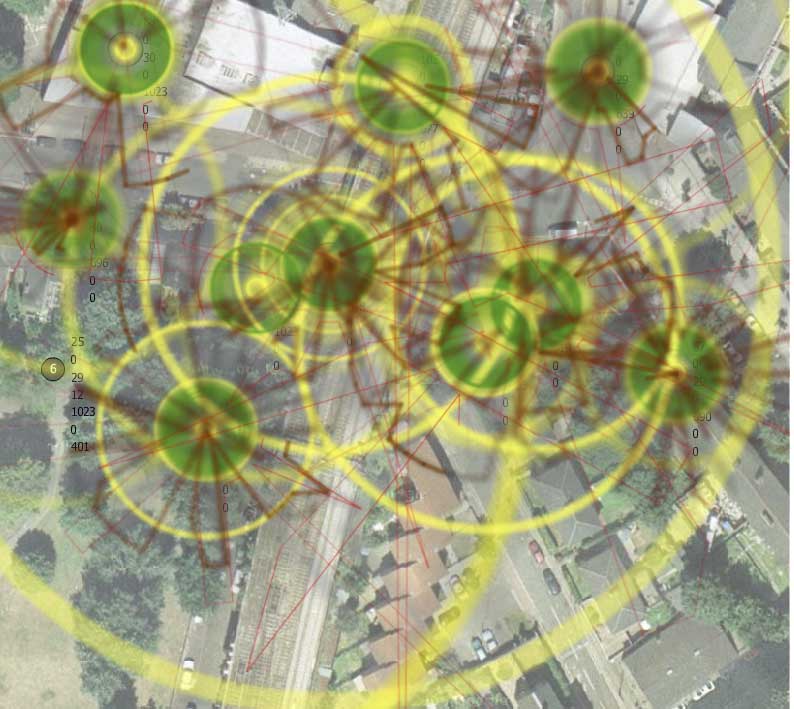
First smart city data visualisation. Sensity Brixton 2004
  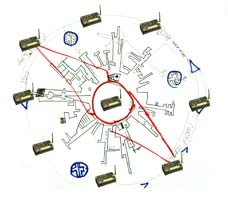
Sketched for smart city data visualisation 2004 as part of Nesta award.
Datacities: The Emergent City. The Mother of Big Brother
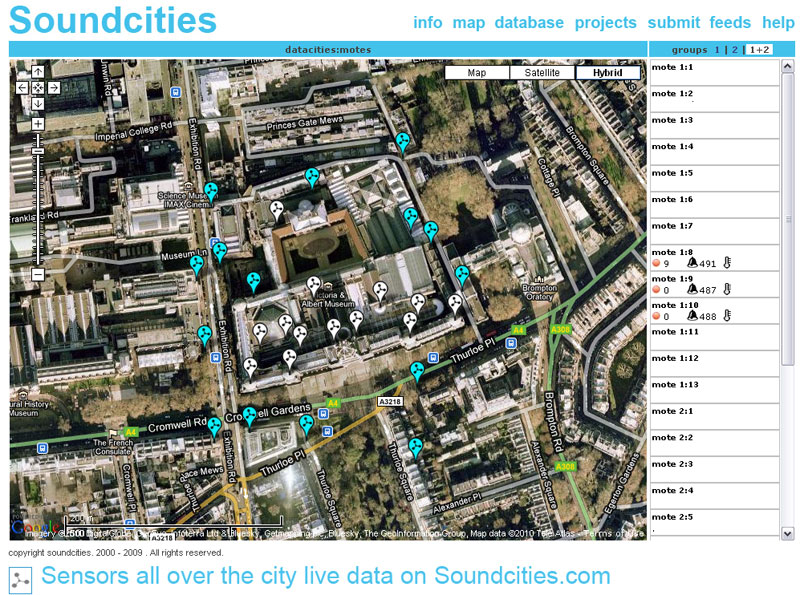
Sensors all over the city. see www.soundcities.com/data.php
Using XML the outputs from sensors are visable on google maps.
The mother of big brother. 2004
Imagine walking out the door, and knowing every single action, movement, sound, micro movement, pulse, and thread of information is being tracked, monitored, stored, analyzed, interpreted, and logged. The world we will live in seems to be a much bigger brother than the Orwellian vision, its the mother of big brother.
Can we use new technologies to imagine a world where we are liberated and empowered, where finally all of the technology becomes more than gimmick and starts to actually work for us? Or are these technologies going to control us, separate us, divide us, create more borders?
Will the securitization of city space create digital borders that monitor our movement and charge us for our own micro movements inside the system?
My wireless sensor network is set up to visualize cities as 'worlds' full of data, a city of bits. These new data-spaces can help us understand the fundamentals of our outside environment.
Can we now use technology to liberate and empower?
Or will it dominate and control us?
My other Artworks using networked sensors across spaces.
House (2006)
A dynamic public sculpture viewable over the internet. House is not a mute memorial to a related past but a live embodiment of change and renewal. House describes the space, a real Victorian terraced house, in this case, that the artist lives in. In “House”, the private interior has been made public. The sensor data unfolds and discloses the inherent properties of the space, creating an online artwork visualisation. The environment is disclosed and made public opened up and made transparent. Collected data through the house senses the living changing flow of the space. www.stanza.co.uk/house/index.html
Gallery (2008)
A dynamic public sculpture viewable over the internet. Gallery describes the space, in this case the upper gallery in Plymouth Arts Centre, England. Made during an artist in residency project in situ in the gallery space during Feb. 2008. The gallery interior has been made virtual and placed online. "Gallery", is part of a series of process led experiments in data visualization within the context on an art gallery. Stanza asks , "what happens during the process of visiting the gallery as a dataspace"; ie what happens to the gallery and what do the visitor do? The gallery laid bare as a work of art. Gallery proposes that the data is art. The art is a real time flow of the things around us that allow our senses to invoke understanding. The gallery space becomes the art described by the shifts in light, temperature and noises in the space over time. www.stanza.co.uk/gallery/index.html
Field. Tree. Park. Lake. (2008)
A series of sonifications and visualisations of landscapes. The artworks made using data from the environment. The landscape becomes virtual, dynamic, and encoded. I am trying to disclose the underlying data that we see that's is changing all the time in front of us. The sounds you hear are streams of data acquired and processed in custom made software from thirty motes sensors; this is changed into sounds.The squiggles or painterly stuff on the image is a response to the changing light, temperature, noise, humidity and pollution of the landscape....which is also fixed by its gps position. www.stanza.co.uk/possibilities/
Sonicity. (2010)
Sonicity is a responsive installation, a sonification of the space. This project investigates the real time space and the experience of the gallery visitor as they interact with the space. The system monitors the space (the building) and the environment (the city) and captures live real time data ( light , temperature, noise, humidity, position) to create an ambient sonification, an acoustic responsive environment, literally the sound of the micro incidents of change that occur over time. The interactions of all this data are re-formed and re-contextualised in real time as a audio experience. Hundreds of small speakers are wired together and an installation is made across the available space. www.stanza.co.uk/sonicity/
Capacities. (2010)
A installation responding to changes in the environmental data. There are electronic components all over the floor. (Fans, Lead, Soleniods, Motors) these move only in response to a wireless sensor network of 40 motes deployed in the gallery and across the environment. The light temperature, noise, humidity of the space and the city. As this data changes this wired city changes. That is the physical world is made virtual and them made real again. IE fans turn when the temperature changes, motors turn when the light changes. This whole piece ia a living and breathing city. The real city is captured made virtual and made real in another form. www.stanza.co.uk/capacities/
Facade (2010)
An interactive responsive architecture linked to the culture of the AOF Nova building within the city of Trondheim, Norway. The objective is for the Nova building to become the focus and the centre of a new social space harvesting data and information from across the city. The facade presents the emotional real time state of the city by using live data and CCTV images to represent the Nova Building as a living breathing entity. Using custom made software the artist will interpret the data collected into the artworks that are incorporated into the display. Exciting use of the Texlon envelope can be integrated manipulate surface quality, with laminate LEDs allows the creation of envelopes of almost infinite visual variety and interest. The surface can be designed to capture projected light for displaying images, video or colour. Each layer can be engineered to transmit, reflect or scatter the image, enabling the full exploitation of the envelope to operate as a visual panorama. www.stanza.co.uk/facade/index.html
Sensity (2004 -2009)
Sensors in over ten cities.
http://www.stanza.co.uk/sensity/index.html
|
|
Concepts
These new networks represent open social sculptures that can inform the world and create new meaningful experiences. The social space is opened up into a real time flow space, a new virtualized data space emerges.
Environmental monitoring and controlled surveyed city space; connecting cities and dataspaces.
The interactions of all this data are controlled via the visual interfaces and re-forms and reconstitutes experiences of the city in real time. The increase of technology infrastructure in the daily existence of a city means that technology will, more than ever be everywhere in our environment. Data mining will be part of the fabric of the landscape. Everything is or will be tracked. CCTV, car sensors, tracking inside our phones and id card movement tracking in the guise of anti- terror activity. The patterns we make, the forces we weave, are all being networked into retrievable data structures that can be re-imagined and source for information. These patterns all disclose new ways of seeing the world. The value of information will be a new currency as power change.
The central issue that is developing is the privilege and access to these data sources. Will these systems be open or closed?
New maps are being drawn up that re define the digital borders, who is going to want to own this.
 |
 |
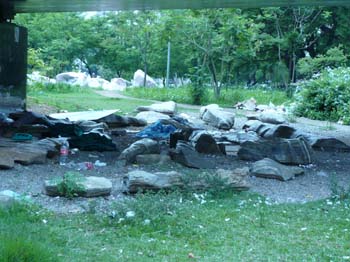
| Peoples "homes" under a road in Sao Paulo. Image stanza 2007 |
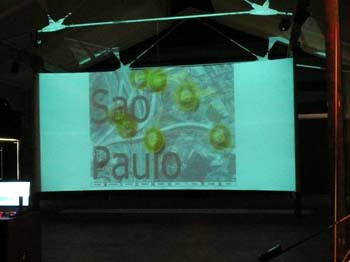
Data feed of Sao Paulo. from Motto Sensity exhibition. Image stanza 2007 |
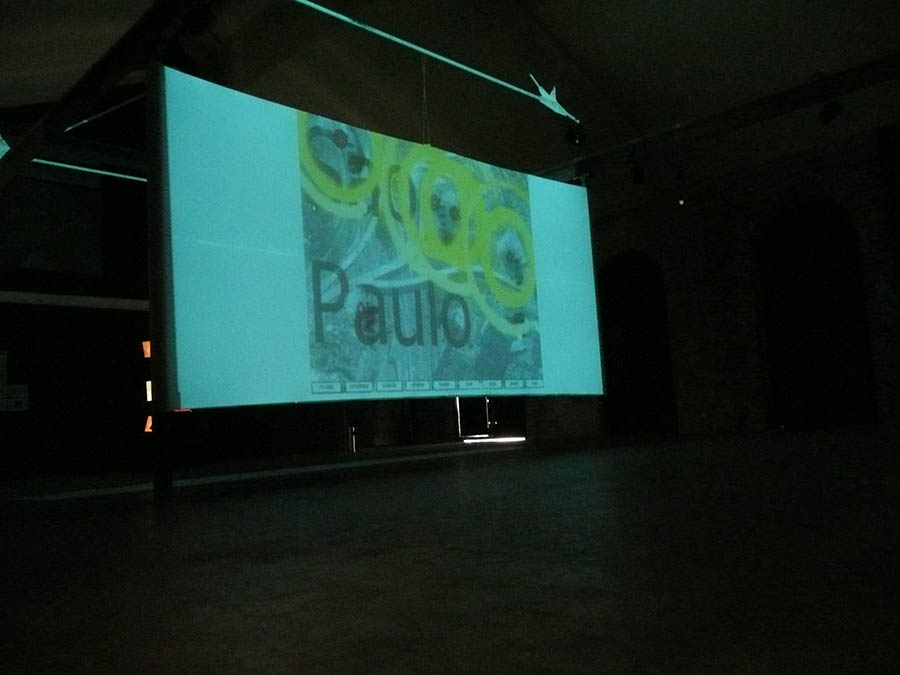
Data visualiation of Sao Paulo. from Motto Sensity exhibition. Image stanza 2007 .
Gathering Assets. Making narrative for creating understanding. Translating what we gather into something we understand or at least into something we can experience.
For any group of users defined variables and fields of data need to be interrogated. Before this can happen cells or spaces where these assets reside need to be created. Once this happens one can in principal "mediate" the information to create artistic metaphors.
To start, decisions about interface interaction can be mediated dependant only variable data. This will vary from data that the user can control to passively die, generative data that runs and interprets various functions My objective is to create new ways of seeing in order to navigate and not just reinterpret other product concepts. It would also be worth bearing in mind that while these projects might well have fixed realizable outcomes such as data visualizations of live city space; they are all focused far into my future works which I envision as articulated responsive spaces triggered by the changing data of space. To facilitate this will require and openness and willingness to share as well as a restructuring of guidelines and ownerships of borders both real and virtual.
Instead of adopting narrative threads from other media, I am interested in the currency that exists already in the city space. These works are focused on the wider picture of city experiences which are being played out in real time. This sort of experience of multi nodes and multi threaded spaces, demands a refined gathering of data, a sensitive accumulation which can then lead to some kind of modeling and visualization. [audible and visual (mils)-representation] of the social network as it exists and is impacted upon.
Things Change
There is a argument to opening up the level of control and responsibility given allows freedom within the system. Its a good argument until something changes, the passwords change, the building goes private, and every single piece of data is used for something that it wasn't intended for. Some things change for the better but sometimes they don't; one thing is for sure; things change. Therefore I am focusing on the things that change, the flow, the data that describes our experience of the city as space. Data from all sides in systems that can be mediated by all, with varying visualizations communicated over the internet and represented onto different display systems.
Display Outputs
Data projections by Stanza 2004 in Brussels and then in Bristol 2004
Other ways the Sensity project can be displayed. Here on a round globe display made by Puffer fish. tested at County Hall London.(above).Thanks to PufferfIsh for allowing these tests. This is a real globe, die a round display system.
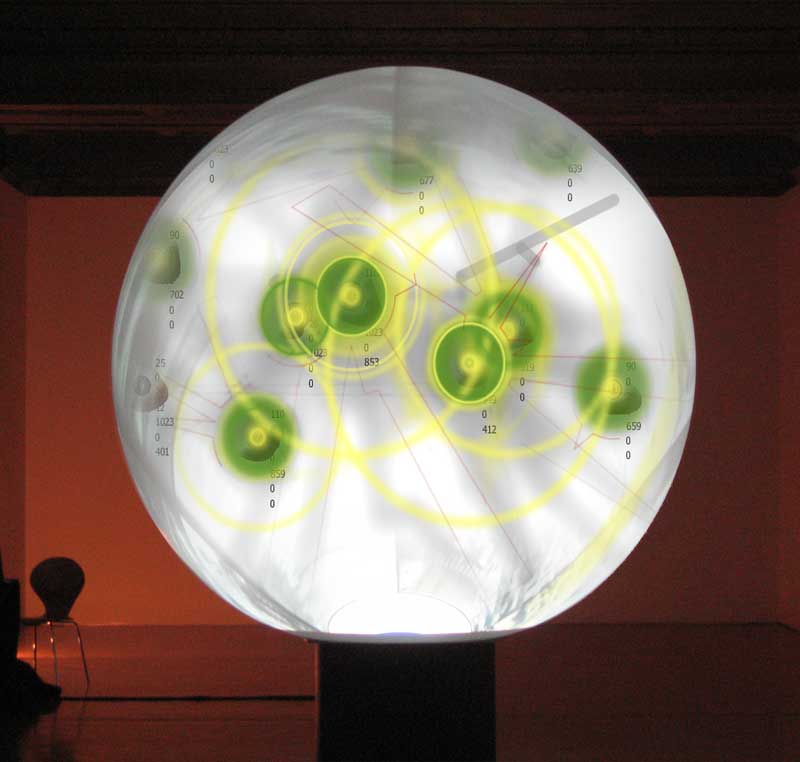
A world full of data. Above image shows Sensity Loci 2006 . Sensity can be exhibited in a number of ways, on this display is one example.
Sensity: examples of projected versions in exhibitions.
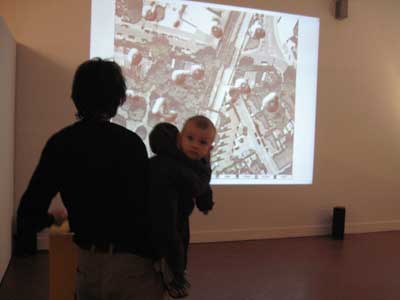 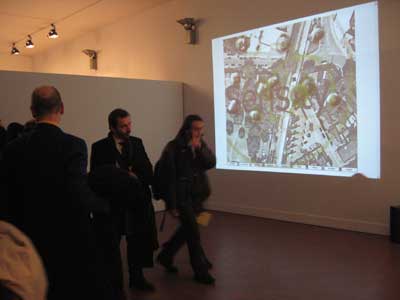
Photos from Sensity projected at Share IT in Italy 2007.
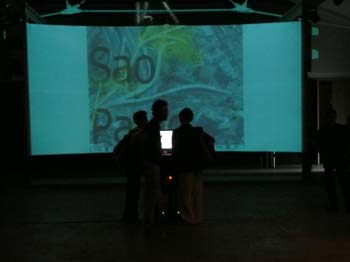 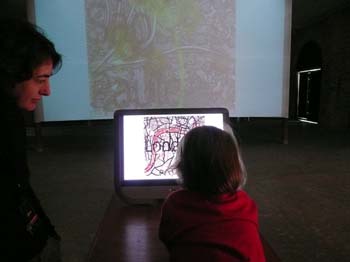
Images from Sensity Sao Paulo, exhibited. Largo Senador Raul Cardoso, 207, Sau Paulo Brazil. Motomix, Sao Paulo, Brazil. 2007.
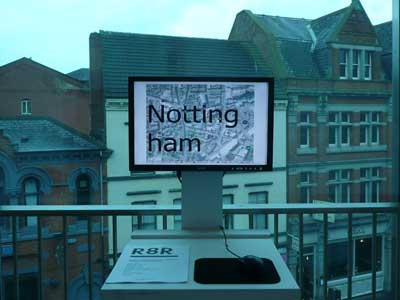 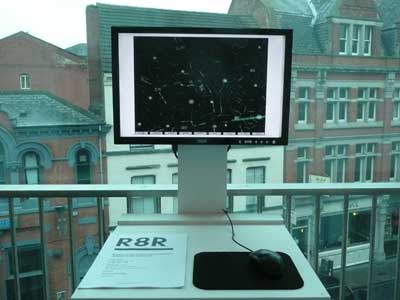
Images from Sensity in Nottingham around the Broadway cinema for the Radiator Festival 2009 .
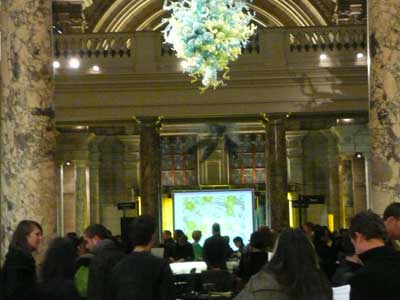 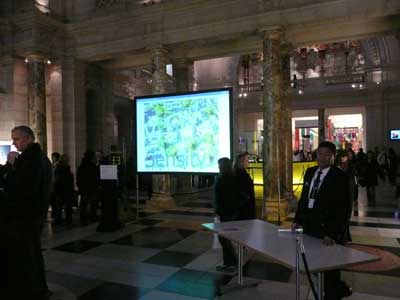
Stanza images from Cybersonica late at Victoria and Albert Museum, London as a digital city on 31 st October 2008
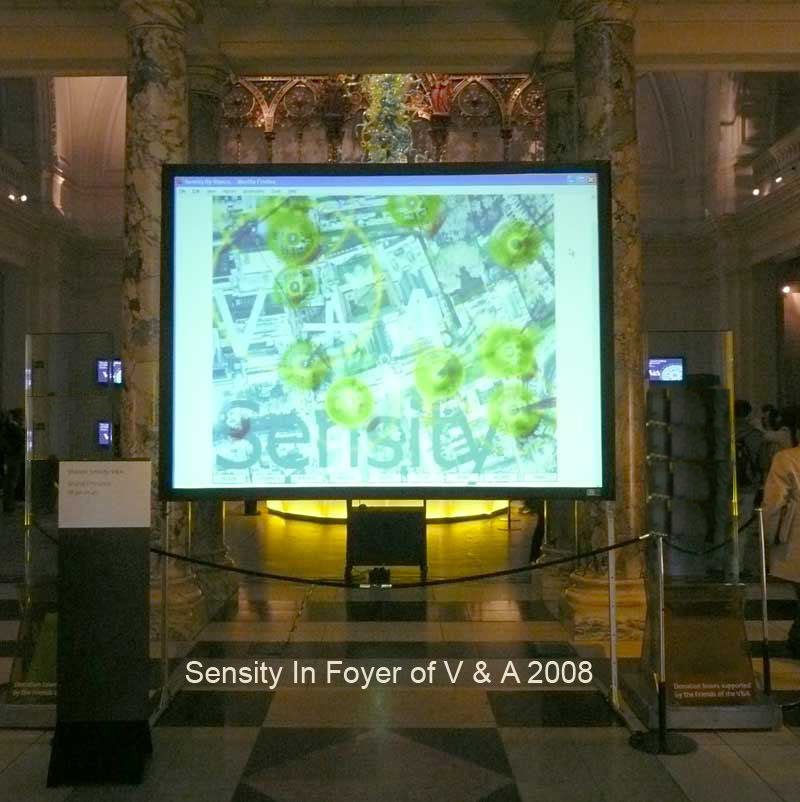
This visualization screen and online work is made for Cybersonica late at Victoria and Albert Museum, London. on 31 st October 2008 and open evening and "Sensity V and A", was installation in the main foyer. Sensors placed around an environment transmit information about the surrounding space that is used to create this installation. London becomes visualised as a digital interactive city. (See above for archived version).
"As I was walking out of the V&A, I saw the big screen  and could hear the ambient noise. The effect was really
really cool -- half wondering if the sound was from the museum, half
wondering where in hell the sound was coming from in the first place:
which is why the map on the screen definitely added to the intrigue." Sarah Northmore
Stanza sensity...Plutopoia at SXSW Austin Texas 2009. Live data cities.
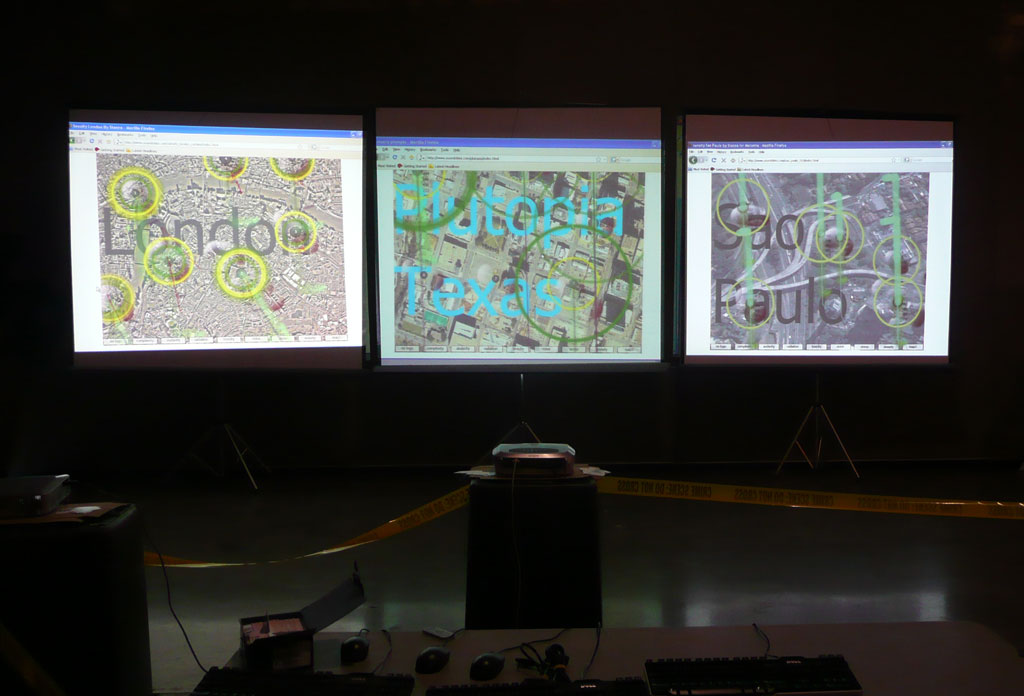 Stanza sensity...Plutopoia at SXSW Austin Texas 2009. Live data cities.
Shown above London, Austin Texas. and Sao Paulo. Interactive sensors
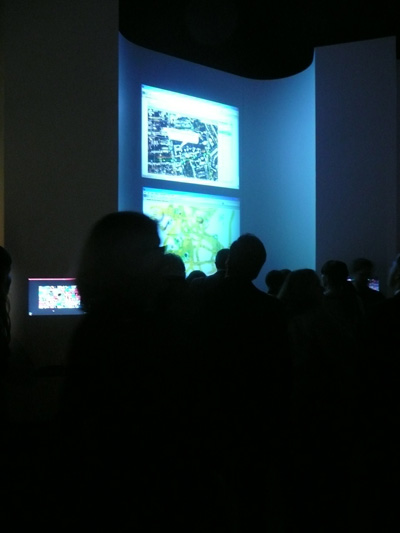 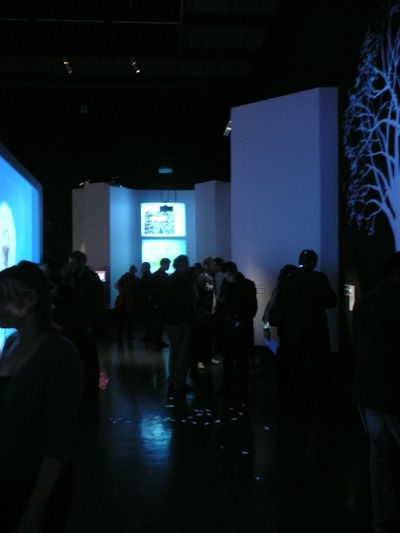 Stanza Sensity...Sensity V & A live at Decode show private view. 2009 .
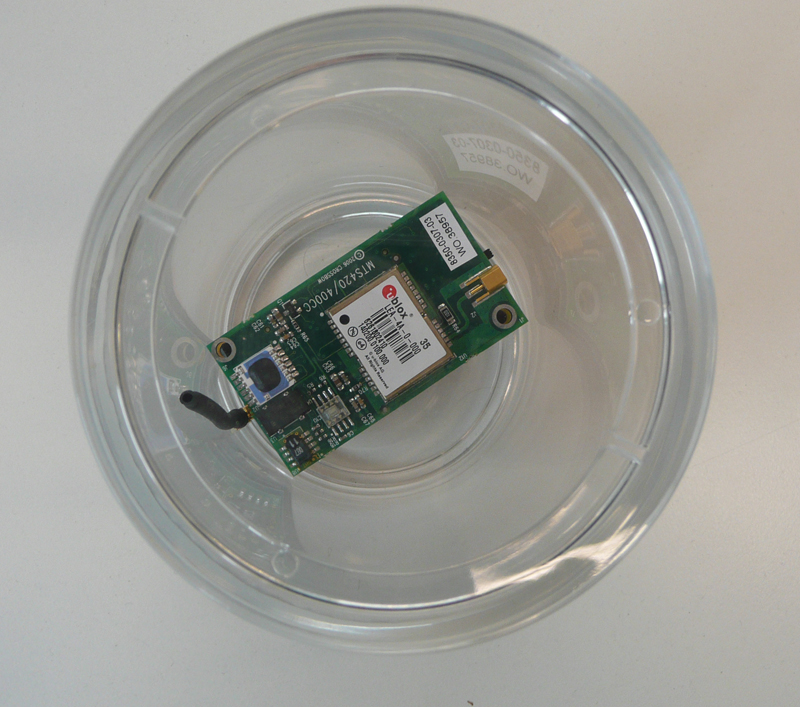
Picture of a mote sensor in a glass contained (housing) before deployment.
|
|
Overview.
I now have two separate kits of twenty sensors for my tests. However thousands of motes can be deployed across the city for gathering data in wireless sensor networks. Used in large numbers they communicate with one another via radio signals across the network. They reconfigure themselves or self heal, so that the network stays stable. The data is funneled through a system to a point where it can then be interpreted. The motes themselves can be deployed every thirty metres depending on the frequency, and 500m with the new ones, and any number can be place in a network. A new mote, just developed allows nine hundred metres without line of sight, suitable for my city wide version.
Each mote can sense its own position, wakes up and find its neighbour in the network. They have low energy use, (but this is a major issue in using them and depends on how you program them) the life expectancy is determined by the battery. In the future it is imagined they will run on solar power, but again these solar panels are very big three book large to power on mote).
My concept is to embed multiple cities with thousands of motes to gather data for the creation of artistic artifacts and to allow other access to the data for city based studies and analysis. Several versions (networks and visualizations) have now been deployed as part of my research into the emergent city and intelligent buildings.
The city experience.
The city experience is a web of connected networks and multi layered threaded paths that conditions us to the emotional state of the city space. In essence, the city fabric is a giant multi user multi data sphere. To take part you really have to put something back in, that's like life. In this case, to take part you have to input data so others 'may' see the output of the data response.
The city has a history of stories relative to time and place, stories from the street. Love stories personal and extreme, crime stories, stories that are small or that can affect global parameters. All of these spheres can be represented by media and therefore by data within the digital realm and becomes a data source so powerful so interwoven that its scale can only be imagined as metaphor. The size and scope of such an archive, of such rich mediated data experience would support many projects. As such it can be interpreted as history via one sort of interface or as a game via another sort of interface. A possible objective is to 'mediate' data into a conceptual artifact. With this perspective there are many unimagined threads of data and connections that describe our world that can be explored within which we can create artistic interpretations.
As we move about the city we art in fact interactive agents, by default we are actors doing our bit and affecting the system. It is this agency that forms the interactive elements in my responsive system.
Noise and Sound Monitoring.
After walking around my local environment and making recordings it has become obvious that noise in the city is everywhere. I thought I lived in a fairly quite area. However, after making a series of walks and sounds recordings this has changed my perspective of where I live. The constant aero planes, and cars, the hum of trains and shouts of people. Even in the park, the trains, and garages making constant noises. The city space is an evolving composition of sounds that bombard us. So much so that we are hardly aware. The sounds of the city presents itself as noise but it is actually the language of the city space. The sounds of the city are the sounds of "urban music".
Noise affects and makes more noise.
The sounds of the urban experience. Sonification
There are now hundreds of "found" sounds collected for 'sensity' in the soundcities.com database. Soundcities is an online resource with hundreds of urban sounds from all over the world recorded by the artist. The sounds are relayed as the sensor data changes in real time and trigger these outputs. Another development in the flash based engines is to use synthesis to make a real time generative music based of the noise values of the city space. In addition there is a new piece of work using sensor data to make sonifications.
Sonicity. Sonicity the sonification of the space.
The system monitors the space (the building) and the environment (the city) and captures live real time data ( light , temperature, noise, humidity, position) to create an ambient sonification, an acoustic responsive environment, literally the sound of the micro incidents of change that occur over time. This sound based work turn environmental data into sound and can be placed anywhere in the world. The sounds can be heard online and also as this unique installation. see http://www.stanza.co.uk/sonicity/
Data as sound. Perform with space.
Using the XML live feeds the data can be turned in music. A custom made MAX/MSP motereader and sound synthesis engine has now been written. This allows one to hear the sounds of space, ie an aual experience of the surrounding space. Additional mixers in the software allow all the sensors to be mixed and cross mashed. Basically this allows you to perform with space.
We just need to move out hands to display the atoms in the atmosphere and make small change to the environment. The new digital world allows us to monitors all change in space over time. My artworks using this information. By moving by making noises the responsive space changes the binary digital world or zeros and ones changes.
Environment.
Light, Temperature, Sound, Noise, Pollution, GPS, Pressure, etc

See sample data set and recorded or archived data sets.
VIEW XML example. London (2004)
Live XML feeds form real time sensors when switched on.
The sensors monitor temperature, sounds, noise, light, acceleration, vibration, pressure, humidity, and gps. The sensors take a constant stream of data which is published onto an online environment where different interface can make representations of the XML and from this lots of artistic interpretations can be imagined.
Also now available live polling from the sensor networks via XML format online. (when switched on)
The data is the medium.
Real Time Feeds when switched on.
motes/mts310/
http://igor.gold.ac.uk/motes/mts420/motestatus.php
http://igor.gold.ac.uk/motes/mts310/motestatusxml.php
http://igor.gold.ac.uk/motes/mts310/motestatusxml_html.php
motes/mts420/motestatusxml
http://igor.gold.ac.uk/motes/mts420/motestatus.php
http://igor.gold.ac.uk/motes/mts420/motestatusxml.php
http://igor.gold.ac.uk/motes/mts420/motestatusxml_html.php
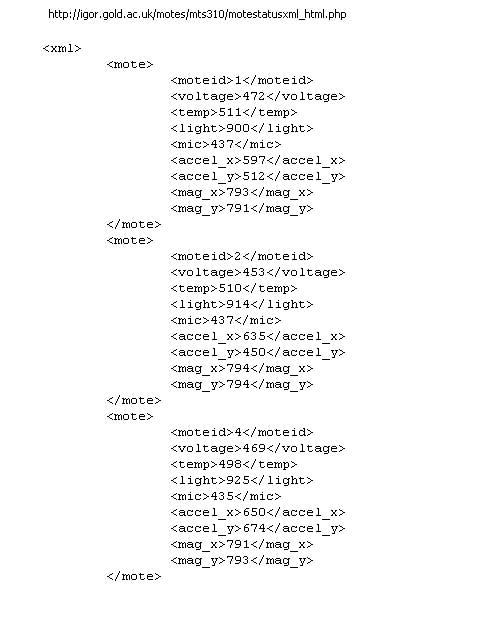
Example xml format for real time data and URL. (remember the data only changes when they are switched on)
What the 310 sensor network as XML looks like:
What the 420 sensor network as XML looks like 2007
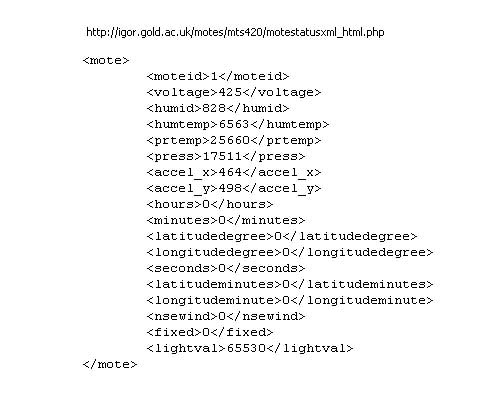
What the 420 sensor network as XML looks like 2007
The sensors are also presented online.
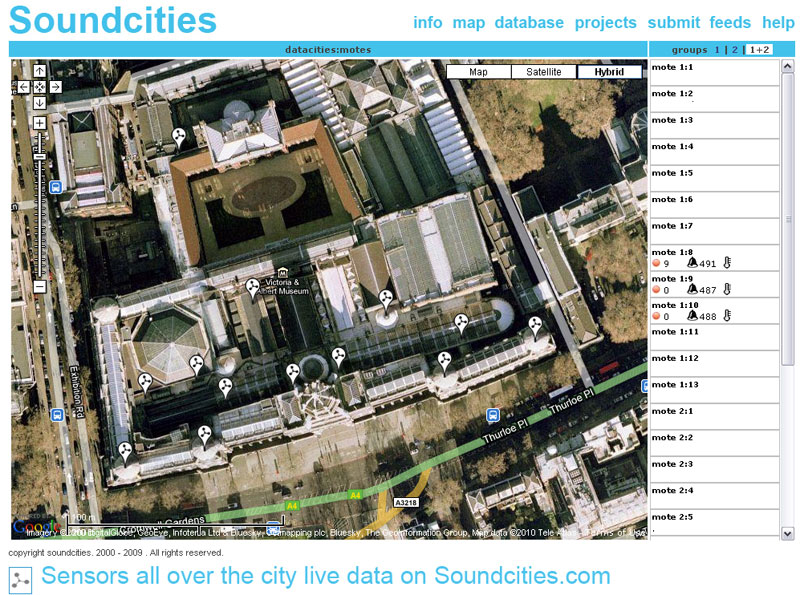
Presented live into google maps and XML streams are published live. www.soundcities.com/data.php
Specific environments and urban networks can be monitored for changes in the micro climate and habitat of spaces and locations. This data can also be used for farming, crops, weather, etc. as well as art.
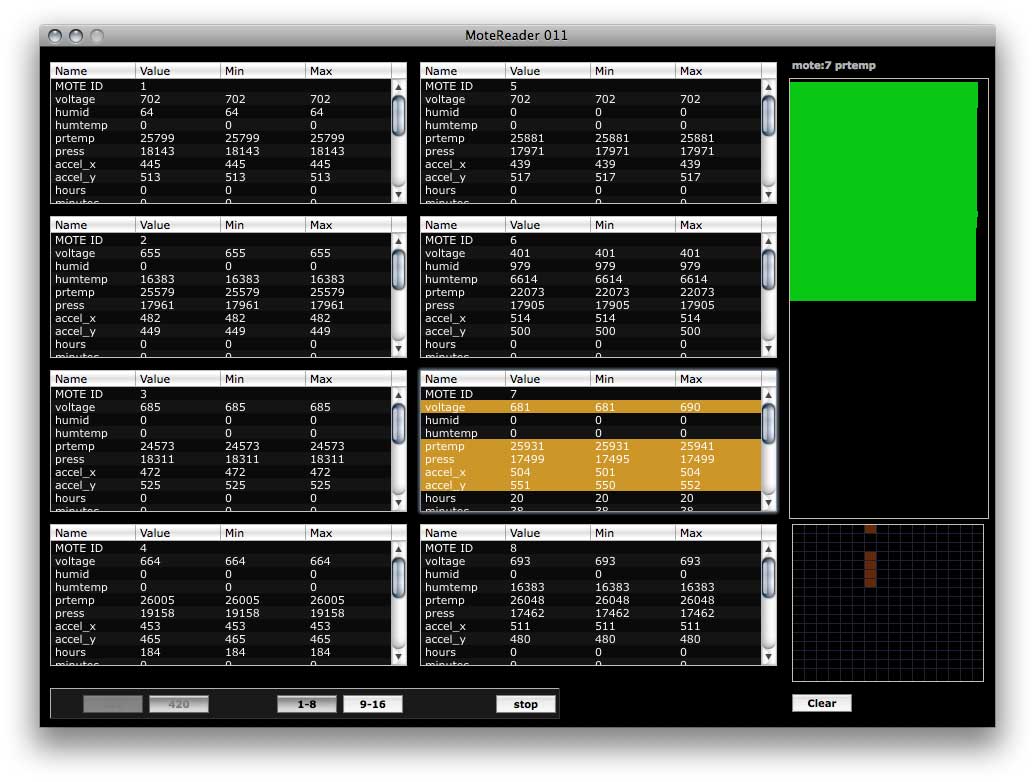
Screen shot of Visual Basic Mote reader which is testing system for the new project Capacities. This new installation is a responsive city of electronics, a city made real from the virtual data captured from the real city.
Sensities. (from the real to the virtual and back to the real )
A installation responding to changes in the environmental data. There will be electronic components all over the floor. (Fans, Lead, Soleniods, Motors) these move only in response to a wireless sensors network of 40 motes deployed in the gallery and across the environments . The light temperature, noise, humidity of the space and the city. As this data changes this wired city changes. That is the physical world is made virtual and them made real again. IE fans will turn when the temperature changes, motors will turn when the light changes. This whole piece will be living and breathing city.
|
|
Technology
The technology presently consists of Xbow's MICA2 motes and MICA2DOT motes. It uses an Atmel Atemega 128L processor running at 4 megahertz. It also has some flash memory to store the program. It consumes only 8 milliamps when it is running, in lower power mode it will run for more than a year. The trick is to write the program so the mote is asleep for most of the time therefore saving power. The mote can wake up for a few micro seconds and then sleep again for period of time. They have an a/d converter so the sensor data can be digitized. The software is written to control the mote is built on an OS called Tiny OS. The chips contain all the components found in a mote: a CPU, memory, and A/D converter for reading data and radio transmitter. Tiny OS is written is Nes C, a special programming language for motes developed at Berkeley.
To do this for the 420CC one has to hack the two programs together for the low and high power mode and then upload via OATP as a lower power version. This was it gets a GPS fix.
In addition.
There is a kit or suite of tools called task which consists of:-
TINY DB. Allows interaction with sensor network through declarative SQL interface.
TASK server. A server running on the gateway acts as a proxy for the sensor network on the internet via xml and interpreted by custom built software.
TASK DBMS. A relational database that stores sensor readings, sensor health, sensors locations, etc
TASK Client Tools. ie a deployment tool, configuration tool and visualization tool.
TASK Field tools. Allow pda for in the field diagnosis.
Issues
The main problems with this project are the technological ones. The have limited processing, storage and communication bandwidth. They require new software and hardware design, they also require the system to be designed so that they easy to use.
The data is the medium. Data and power
Ethics of security in public domain social space.
Motes and sensor based networks also raise serious issues about privacy and security that will cross the collaborative borders and merge with legislative issues. ie how does one actually displace these in the real world.
Future projects
Maps of the future responding to chemical changes in the atmosphere
Regions and online map of people behind on rent and mortgages flagged on google maps.
Online maps of people with HIV with ID info.
Live tracking of ethnic groups to redefine territorial borders and diversity
Real time surveillance of child offenders.
Real GPS positions of children for protection.
Merged city map of ethnical groups globally.
Debtors tracking map.
Media centres connected into world mediated space.
Facebook time online cluster for those at work.
Tax records online linked to all bank accounts
Insurance linked to all doctors visits linked to passport office.
Trackers in phone and passports linked to immigration and earnings.

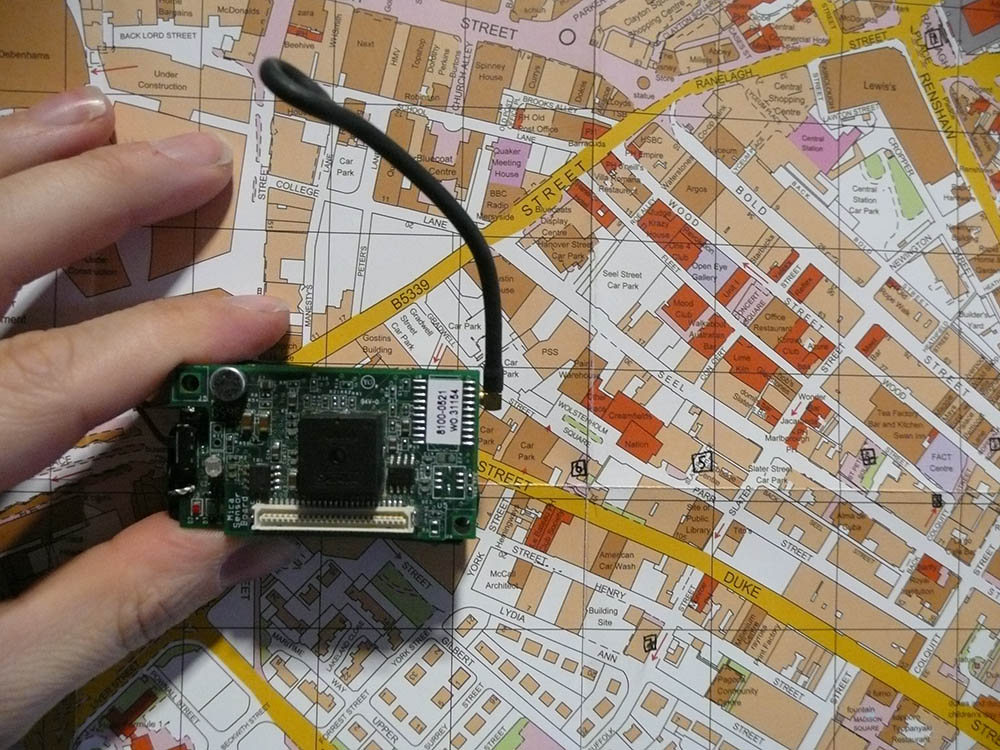
The wireless city made virtual with sensors 2004
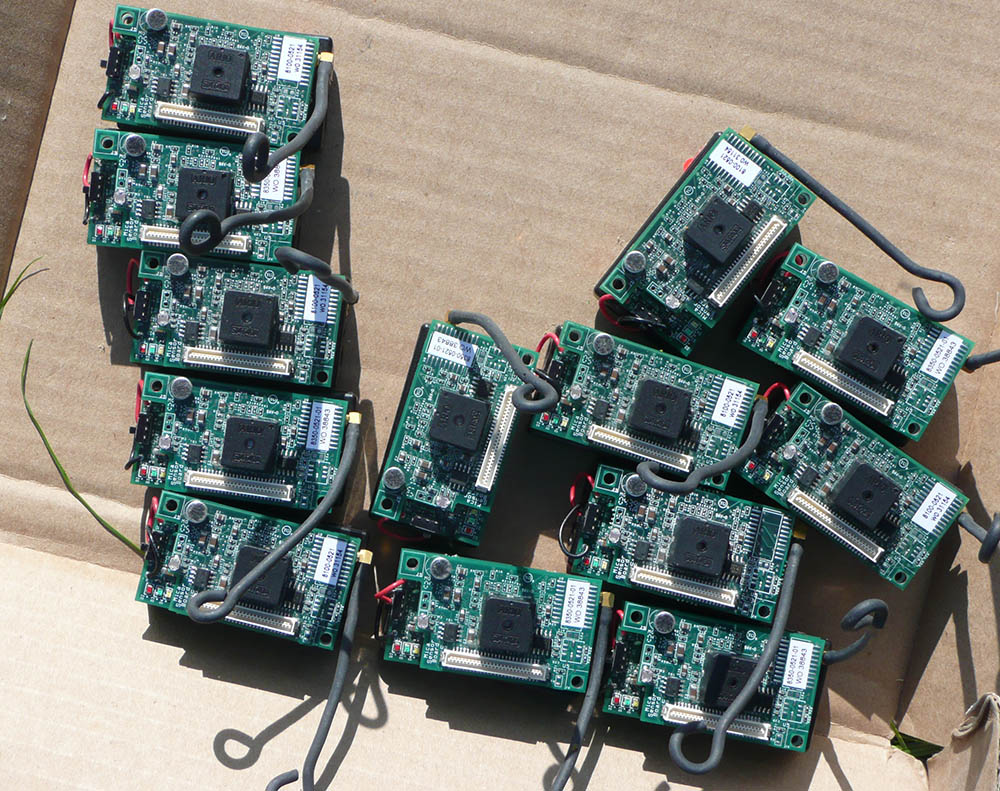
One of the sensor kits getting ready for programming 2006
|
|
The Living City
Is the city truly emergent? Can the city be called an organism?
If so what about the validity of the city experience in relation to its 'character' 'soul' of spirit'?. By collecting such data we monitor the urban landscape enabling us to see and understand the emotional city and its sensory behavior. In essence these smart networks will have data open to all, and not closed off spy surveillance oriented systems. The network will be an open social sculpture that can inform the world to create new meaningful experiences.
|
|
Future Cities. Connected Virtual Spaces.
Future cities will be merged real time connected up data cities. Sensity connects up networks of real time information flows. The results are mashed up cities and real time performative city mashings. The shared data space can overlap and there is a new space the space in between that only two nodes share. The aestheticization of the shared city space. In the experiment below I have merged collected data from various cities. The images below show an integrated architecture the space where the cities overlap and create a new architectural space. This trial shows connected up cities data from three cites over layered onto the same map or images.
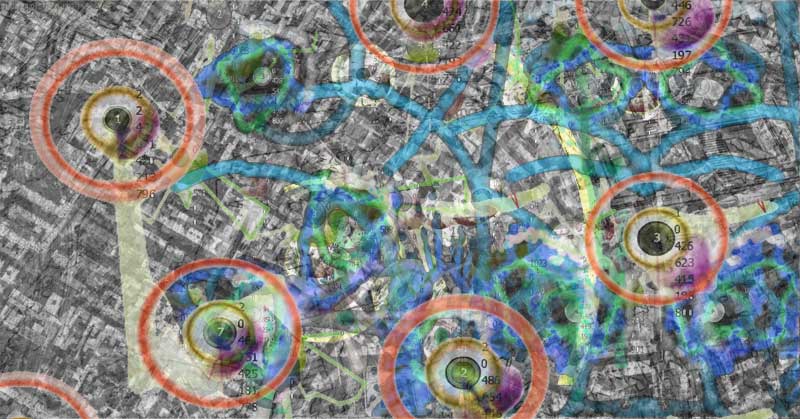
Above image shows xml data from London and Copenhagen mashed up together to form a mixed merged connected city space. Stanza 2008
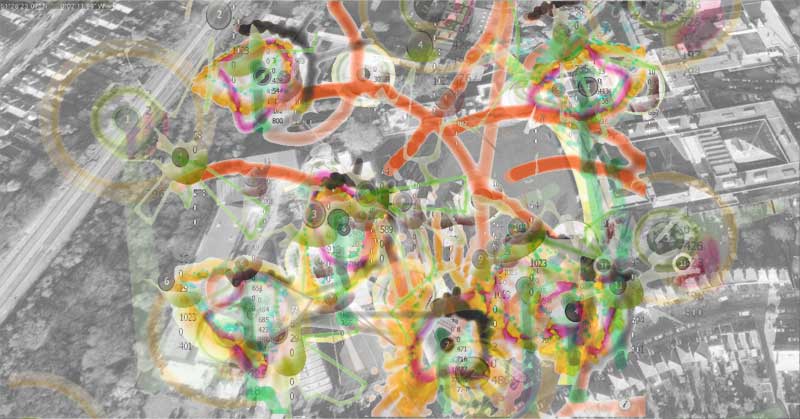
Above image shows xml data from London Paris and Copenhagen mashed up together to form a mixed merged city space from a period of three days. June 2008. These data defines the shape of the city transforms how we perceive the city. They transform the wheres, whens, hows we will use the city. These patterns drawn to screen by the live city data affect the readability and knowability of the city.
There are many types of recording devices in the city from cameras to mobile phones. I envisage the city of the future will start to build a system that will integrate this data into a semantic city of real time data maps. A visualized flow city data experience will allow us to see 'the soul of the city', the undeying tensions human interaction exerts on city space. By mixing the XML outputs (feeds of data) of the various cities one can create interfaces like these to mash up the city experience into common themes and poetic threads as well as threads to do with more common types of data:- deaths , births, voting, ethnography, etc, An intelligence of space is ths created based in this disclosure.
AUDACITY : ELECTRICITY: VELOCITY: COMPLEXITY: ATROCITY: PUBLICITY:
Future Cities. Technology
The general hope is that these motes, this technology will become so small they will become 'dust'. They are therefore being called 'smart' dust. This is still a long way off. The technology, despite the preaching is still costly, and devices are also very unstable when deployed. This type of proactive embedded computing will be hidden inside the fabric of our lives and our environment. It will be inside the fabric of the real city creating a new emergent data city. The real world will become virtualized into an archive retrieval system using such a system. The emergent city is a sense city embedded with millions of computers to re-engage with the urban fabric and to enable new artistic metaphors within city space. It will enhance out experience of city space as well as monitor both the the environment but out condition and movement and place within the city space. This brings up data regulation as the control of these systems increasingly become part of a data marketplace.
Other technology observations.
Most of the issues to with motes are to do with power over time, and then trusting that the sensor packet data you receive is accurate, (and not because the power of technology is failing). I have now spent six years messing, playing and testing this equipment and making a whole range of discoveries with it. This has led to the development of new software to get them to work and be deployed.
But overall; as a practice based artist such a complicated technology I have to say it been at times a serious struggle. This is because most of the technology research has been hampered not by my ambitions for the project but by the unstable nature of the technologies, connections and networked involved. As well as the poorly supported manuel's that are at best misleading and at worst just wrong. ( see the blog for tech workarounds and solutions).
Review Of Sensity. By Mark R Hancock.
'Instead of adopting narrative threads from other media, I am interested in the currency that exists already in the city space. These works are focused on the wider picture of city experiences which are being played out in real time.' Stanza.
Unseen geographies of our cities lay around us with areas yet to be discovered. Much of it seldom noticed as we pass through them in our everyday lives. The traces of our journeys through each city leave temporary presences. There was once a time where many would have believed these traces were spirits, psychic remains, registrations and impregnations onto objects and environments, from what was possibly a traumatic event in time. Are contemporary technologies a realisation of this belief? These technologies that record our movements in time, are no longer odd, or alluding to being mystical occurrences but the switching of sensors and transmission of radio waves through the ether.
The sensors deployed for Sensity measure temperature, sounds and light as well as the humidity and vibrations, around each recording and transmission unit. Depending on the deployment (there have been several across different cities in Europe) the units are used for different combinations of these discrete elements. But rather than taking finite measurements at a moment in time, mathematically, the notation is delta, registering the change over a period of time. The difference between one state to another that brings our attention to the changes around us, where we may imagine the world around us has not altered very much, but the data gathered from the sensors tells a different story altogether. It draws our attention to the ever-shifting mood of the city. This ebb and flow, viewed over a period of time, might, one imagines, bring about some kind of anthropomorphism in our relationship to the environment. In the same way that an anonymous animal, viewed over a period of time, gradually shows personal characteristics, so does a city. It becomes a barometer of all our psychic imprints on it. As Stanza says in the project documentation:
'These artworks represent the movement of people, pollution in the air, the vibrations and sounds of buildings. They are in effect emergent social sculptures visualizing the emotional state of the city.'
Stanza regards this change as vital to the work,
'Some things change for the better but sometimes they don't; one thing is for sure; things change'.
Presumably this means the physical space as well as the social aspect (psychic well-being?) of the environment. The two are like a bio-feedback loop. But what is it that Sensity reveals to us in its visualisation of the city?
One of the moods of the city is 'fear' of the consumer class. A very contemporary class, replacing what we once knew as the working class, caught within the trappings of an economical reliant state of bourgeois anxiety. The consumer classes who, it might be suggested, consume without question and are more likely, in their drunken Saturday night release from the pressure of state-endorsed nullification of the desire to think, to destroy and cause chaos. The CCTV cameras aren't trained on the would-be anarchist, or political dissident. It's the masses that scare the state, with their potential to destroy property. A hungry, voyeuristic CCTV culture is there all around us, and it works more subtly than we might imagine[1].
Sensity can be viewed as a way to challenge or exploit the power balance of state imposed surveillance systems like CCTV, mobile phone monitoring and car monitoring (for example, cameras installed on buses to monitor the illegal use of bus lanes in the city). There is, of course, an ongoing struggle between the population on one side and the privacy concerns of the population on the other side. And if these spaces are public, how much of our own surveillance technology are we allowed to deploy? The argument over public space becomes not just one of ownership, but of how much freedom we are allowed in those spaces. Anyone who has spent time within a shopping mall, soon comes to realise that you are only visiting those public spaces, and are allowed little more than the 'privilege' of being within them to consume products, that's the deal. It would be good to imagine that the changes monitored by Sensity are working in favour of the ordinary public, rather than the elite who are most often served by the surveillance technologies. After all, aren't most CCTV cameras deployed into areas of commerce and entitlement? Nobody cares what the general public actually gets up to, as long as property isn't destroyed and the reputation of the city isn't compromised. Of course, when the government talks about the general public, they mean the British working class, the consumerist, a celebrity-obsessed class. And in particular, those of us employed to work in the inner-city space, rather than live there. You can visit, work and spend your money here, but you must return to your own dwellings! Owen Hatherley points out this ambivalent attitude in the introduction to his book, Militant Modernism (2009):
'The pervasive class hatred only slightly below the surface of British life (what else does the word 'chav' signify?) centres on the feared or ridiculed estate dweller.'
But whereas Hartherley is discussing the issue of Modernist architecture in relation to political standpoints and the class system, Sensity, through its monitoring of the movement through those architectural spaces, presents a human-centred perspective tracing our movements, rather than the monumental buildings.
If we are truly to once again have ownership of our own spaces, then isn't the right to deploy surveillance technology one of those rights? The argument of course, is as much about who owns the data, as who is collecting it. And to what use it will be put. Stanza takes the data to measure our existence in public spaces to 'create artistic metaphors.' These metaphors are the visualisations of existence projected into the exhibition space and online. These metaphors are like seances, drawing out the spirits of the city. Tapping into the spirit metaphor again, it is possible to communicate with the city and the inhabitants who are the cells and organs of the spaces. Sensity offers the city a chance to tell a different story.
On the Sensity website, clicking on the images activates the simulation of the recordings. The slightly blurred images of cities or park locations are covered with puffy clouds of 'data' moving out from the points that mark the locations of the sensors. The effect is hypnotic and gives more to the patient viewer than the casual observer. This isn't the sort of artwork that the viewer should cast a casual glance at and then move on. It requires time to understand the change in the data. Where there is audio content, the click and stutter of noise begins to build a symphony of sounds that can hover just at the edge of recognition before fading away. Numbers form and then change, always offering a sense of movement.
What is being observed within the gallery is something that has already happened, an historical moment that has passed. Conversely, this gives the work its strength as a comment on contemporary time. The work sits within time and acts as a reminder that we are constantly in flux. Despite the many questions that it raises about the cityscape and urban life, this constant change offers a reminder that there is always the future to look forward to. If everything is constantly changing, there is always the possibility of reaching possible states of alternate contentment.
Review Of Sensity. By Beniot Bordeleax
Pour une cité sensible. La Sensity de Stanza.
Alors que plus de la moitié de la population globale vit en contexte urbain, la ville est désormais prise pour acquis. La plupart des habitants, engoncés dans leur routine, oublient de regarder autour d’eux, sauf quelques flâneurs en puissance s’amusant à trouver de l’insolite au fil de leurs parcours familiers.
Stanza nous offre avec Sensity, un projet en branle depuis 2004, de nous réapproprier l’espace urbain sensible en le remixant. Déployant un réseau de capteurs mesurant l’humidité, la luminosité, les vibrations, le taux de pollution et les bruits ambiants tout en étant reliés à un système GPS, l’artiste a collecté des données dans plusieurs villes du monde dont Londres, Paris, Copenhague, Sao Paulo pour ne nommer que celles-ci. Ces données sont alors synthétisées et mixées afin d’offrir une tout autre expérience d’un quartier ou d’une ville par le biais d’une visualisation sur le Web, d’une installation, d’une projection, etc. Le potentiel ne manque pas en ce qui concerne les différentes incarnations issues du même matériau de base.
On constatera que Stanza offre à voir et à entendre des visualisations générées grâce à des matériaux captés en temps réel. Au premier coup d’œil, ces portions de cartes tirées de Google Maps, dans lesquelles des pastilles grises symbolisent les différents capteurs utilisés. Autour de celles-ci se dessinent des cercles, des traits erratiques et ce, sur un fond « musical » cacophonique, qui ne ressemblent en rien à l’expérience que l’on fait de la ville au quotidien.
L’intérêt est moins porté sur les sensations d’un individu en particulier, mais invite l’internaute à effectuer une flânerie dans un univers entièrement constitué de données. Le chaos apparent se résorbe à force d’une écoute et d’une observation patiente, donc s’inscrivant dans la lenteur, en rupture avec la vitesse des flux de la ville. Une certaine structure musicale émerge de cette gibelotte de faits urbains et n’est pas sans rappeler la musique industrielle. Aussi, les effets visuels générés par l’œuvre subissent des changements traduisant différents atmosphères. D’un simple clic, sons et strates d’images peuvent être retirés de la visualisation en employant les boutons situés au bas de l’écran.
Pour apprécier cette œuvre, l’internaute doit prendre son temps et se dépêtrer de sa logique de lecture efficace. Sensitymet en lumière le bouillon – l’éruption! – sonore auquel chaque passant est habitué et le tenant ainsi pour normal. Ce « mashup » audiovisuel nous pose devant le visage véritable de la ville d’aujourd’hui. Si l’architecture, par le biais de l’urbanisme, a permis de canaliser les déplacements des citadins, voire les domestiquer, dans les fragments urbains exploités par Stanza, l’environnement sonore reste quant à lui tout à fait sauvage. Sensity a le mérite de proposer une esthétique intéressante en accord avec une réflexion actuelle et essentielle sur le monde qui nous entoure. Si le résultat est déjà une réussite en lui-même, les réseaux de capteurs déployés par l’artiste restent tout de même de petite échelle, considérant les coûts du matériel impliqué. Bien plus que quelques morceaux de la nébuleuse urbaine, c’est le monde en entier que Stanza veut conquérir et mettre en musique.
Rappelons toutefois la figure du flâneur qui a été évoquée pour parler de la posture de l’internaute ou du spectateur. Il n’est pas ici question d’un regard appareillé par la marche, comme a pu le proposer Benjamin en parlant du flâneur baudelairien, mais plutôt appareillé par un réseau qui, à son tour, permet au spectateur d’exercer son regard et son écoute librement, y allant ensuite de sa propre critique. Cette dernière rend possible le recul du spectateur vis-à-vis ses perceptions habituelles, une réflexion sur ce qu’est devenue la ville aujourd’hui en forçant à mettre de l’ordre, rationnaliser le chaos audiovisuel présenté par l’artiste. Éventuellement, cette prise de conscience pourrait être vécue par tous grâce à la miniaturisation des capteurs (de la poussière intelligente espère Stanza), qui permettrait de rendre le matériau urbain sensible au même titre que les citadins. Le paysage urbain n’est plus simplement de verre, d’acier et de pierre. Il faut y ajouter les données qui, dorénavant visibles, permettent de consolider autrement la relation de l’être humain au labyrinthe de la ville.
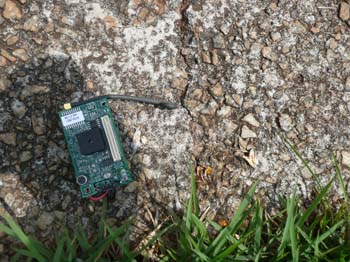 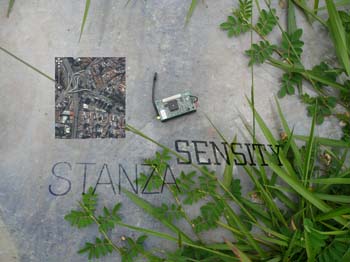
Sensors getting ready for deployment in Sao Paolo
TECH Outputs. 2004 - 2010
- online environment for monitoring of data for open access. (urban and rural) (done)
- back into urban (or rural) spaces as projections/ installations/ networks/ (done)
- projected into fabric as smart sculpture or intelligent building (done)
- data built into sensory sculpture that acts as environmental monitoring system, testing various research questions specified elsewhere (done)
- through display systems as installations. (done)
- can now be used for tracking and monitoring for surveillance space using GPS data from 420 CC. (done as XML feed)
- tracking and monitoring cities using GPS data from 420 CC as live drawing using processing. (in progress 2009)
- tracking and monitoring cities using GPS data from 420 CC as a musical system. (done 2009)
- acquired and tested first versions small prototype and gathered some data (done 04)
- got some more sensors 25 now set up second small network and GPS. (done 07)
- create over the air programming, install on all motes. (done 04)
- collect data via xml and publish online (done 06)
- collect data via php and publish online and open sourced (done 08)
- develop semantic tag system for sensors interrogation. (needs tech support: done)
- figure a way to interpret this visually via the feeds in flash. (done 04 - 9)
- figure a way to interpret this visually via the feeds in processing (version 1 done)
- develop a way to interpret XML and rebroadcast wirelessly zig bee to another physical source, (prototypes made)
- develop visual interface for audio via MAX MSP motes control and is now a project called Sonification (done)
- create a proxy server to poll data off motes on real time from online over tcp ip over the net (done)
- create a proxy server to poll data off motes on real time from a local server; ie by-passing a router (done)
- create real time visualizations that work online from polled data, ie remake recorded versions to be global across networks (done)
- create installation and sculpture ie, display the data. First make visualizations and then make a prototype. (Done three versions.)
- research polymers and materials science as possible display. (in development, not much progress beyond research)
- research leds as possible display. (anyone to collaborate on this - version one done )
- create /find partners and work towards city based dynamic artwork. (Still trying to find project partners in the UK).
- the new system has GPS. I have to incorporate the data into a newer visualisation. This will lead to real time performative city, with people wandering the streets and tracking their position ie the Body in the data space.
- experiment with display outputs, projectors and pufferfish display. (done)
- Bought some new nice looking housing as the housing supplied by Xbow is rubbish (done)
- make xml output display from xml to 3d stereo interface, using stereo rig (nice experiment to do)
Tech visualisation
- resize to 1024 by 768-(done)
- makes sure buttons work on mac also (done)
- save this version (done)
- start new version (done)
- Put bubble effects on each sensor node reacting to values (done)
- zoom feature to zoom onto specific sensors. (done)
- move sensors and save new position.(done)
- import and save new background image. (done)
Sounds What's Can Be Done?
Simple flash engine
Director into flash sound engine
New series of java sound environments developed and MAX MSP real time sound engine for motes
Archiving
Xml saving and clearing cache (done)
Save xml in flash or pull from database and import previous version. ie replay data along timeline.
Replay hour to hour along a timeline (in progress)
Technology.
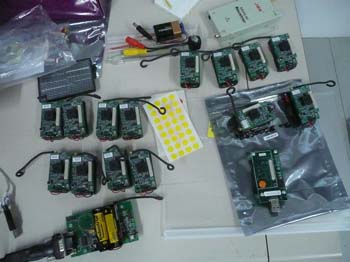
I am using MIB 500 as a gateway, plus Mica 2 processor boards at 900 htz with MTS 300 ca ( light / temp /acoustic boards)
Xmesh build for MTS 300CA is the same as for 310. Broadcasting on ttys6 which is com7. Trying to achieve true mesh architecture. Using Moteview 1.4 the baud rate is at 546000.
When programming base station make sure ATAP is unchecked. Mote config is buggy and often needs to be re-started. Also check system and exit active programs ie, XOTAP.exe then restart mote config.
Milestones in the technology development of Sensity.
A motereader software has been developed. Its at version 1.6 and allows real time online gathering of the data off the sensors through a server.
The motereader has also been remade as a local server (apache is needed on the local machoine and ports needs to be changed)
An xml formatting system has been developed that allows the data to be seen in real time online in XML format.
A series of flash scripts have been developed that allows the real time integrated and visualisation of live data from the sensor network from anywhere in the world.
A series of Max/Msp patches for sound sonification of data have been developed.
A visual basic reader has been developed for the physical computing side.
Flash based interfaces for real time and local version have been made for both real time and archived versions of the visualisation.
An online xml interface has been developed for online real time sharing of data.
All sensor data available on google maps.
© stanza. 2004 - 2010. www.stanza.co.uk
|
|
Funding.
Sensity research funding from 2006 - 2009 was supported by The AHRC Creative Fellowship at The Goldsmiths Digital Studios, London. 2006 - 2009
Initial research was supported by Nesta and the Clarks Bursary and developed into new research.
Credits. Stanza (Sensity Project)
Sensity is a Stanza artwork under the Global Title of projects 'The Emergent City.' see www.stanza.co.uk for all the other projects
Art, sounds, concepts, development, research, production, web images, interface design , text, data viz, artistic concepts, by Stanza.
For more information visit.
Technology Credits.
Motes, programming,technology set up, research, hardware implementation, web development, etc 2004 2009. Stanza.
Other
JAVA moteproxy and server trouble shooting, tech support. Eamonn Martin .
Alpha and Beta Flash version support and coding with Adam Hoyle.
Incorporates XML and live feeds from stanza's www.soundcities.com.
XML into flash socket function trouble shooting for online use from Neil Jenkins
Mentoring Support.
Professor Janis Jefferies Director of Digital Studios Goldsmiths college, Head of Visual Arts.
Offering support in the contextual development of this project in relation to the visual arts.
Related Research Blog. The Emergent City
© Copyright stanza 2004-2010 Stanza www.stanza.co.uk
----------------------------------------------------------------------------------------------------------------------------------------------------------------------------------
About Stanza.
Stanza is an internationally recognised artist, who has been exhibiting worldwide since 1984. His artworks have won prestigious painting prizes and ten first prize art awards including:- Vidalife 6.0 First Prize. SeNef Grand Prix. Videobrasil First Prize. Stanzas art has also been rewarded with a prestigious Nesta Dreamtime Award, an Arts Humanities Creative Fellowship and a Clarks bursary award.
His artworks have been exhibited globally with over fifty exhibitions in the last five years including:- Venice Biennale: Victoria Albert Museum: Tate Britain: Mundo Urbano Madrid: New Forest Pavilion Artsway: State Museum, Novorsibirsk. Biennale of Sydney, Museo Tamayo Arte Contemporáneo Mexico: Plymouth Arts Centre: ICA London: Sao Paulo Biennale:
His mediums include; painting, video, prints, generative artworks and installations. Stanza is an expert in arts technology, CCTV, online networks, touch screens, environmental sensors, and interactive artworks. Recurring themes throughout his career include, the urban landscape, surveillance culture and alienation in the city.
Educated in fine art at Goldsmiths College in the early eighties he later went on to study at Greenwich University and Central Saint Martins Art College London. Stanza returned to Goldsmiths College as a AHRC arts research fellow. He is a pioneer of net art and was one of the first to use internet art as a medium. His websites and net specific artworks have been online since 1995. In the last ten years these online projects have received over four million visitors.
Artistic Statement about current research and practice.
I am researching data within cities and how this can be represented, visualized and interpreted. Data from security tracking, traffic, and environmental monitoring can all be interpreted as a medium to make artworks. I seek to investigate new ways of comparing, conceptualizing and then visualizing complex concepts related to the relationship of emergent data and real space in the built environment. Through practice based research, a series of modular experimental artworks will be created to express the possibilities for our data-mediated future. There are three strands of my working process; these involve collecting the data, visualizing the data, and then displaying the data. The outputs from the online interfaces and online visualizations can be realized as real time dynamic artworks as diverse as installations, and real objects, made out of new display materials back in physical space.
Sensity on a round 3d display as output of data stream. 2006 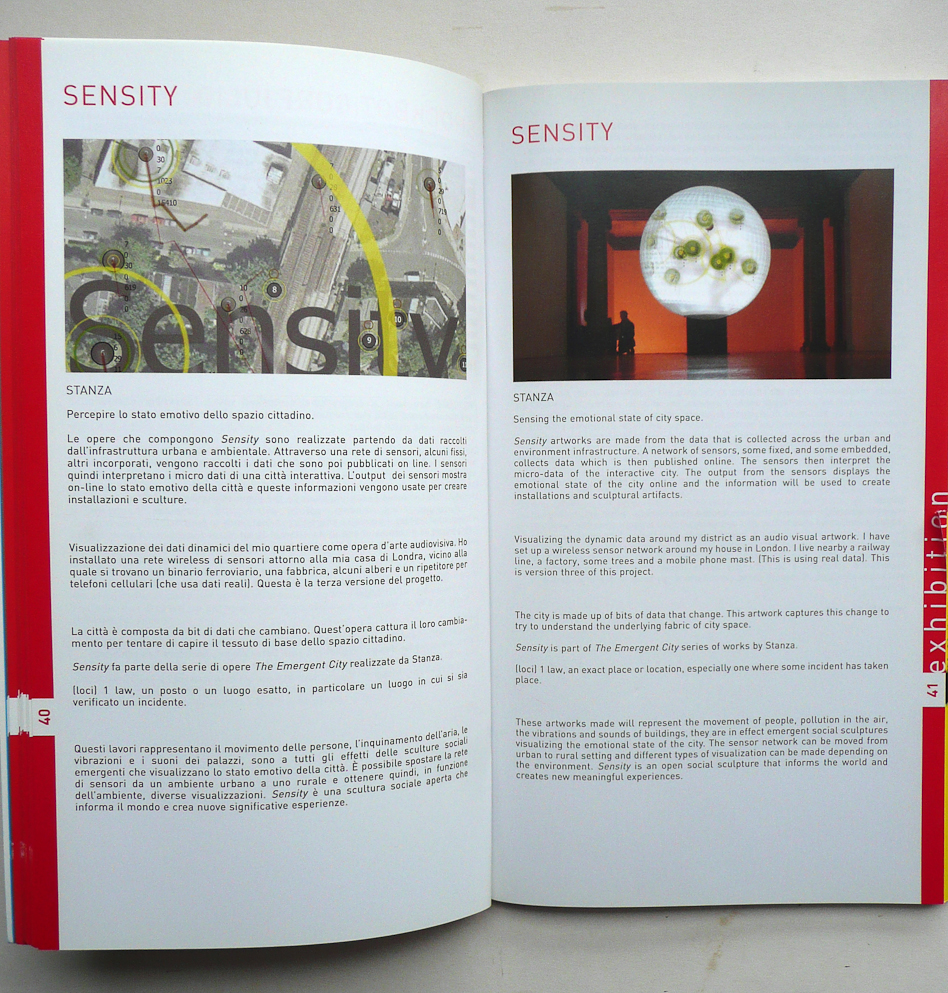

Disclaimer
All rights reserved. The copyright for any material published on this website is reserved. Any duplication or use of objects such as images, diagrams and texts is not permitted without Stanza's written agreement.
All images text and artwork © Copyright Stanza 2004-9
HI RES IMAGES AND ESSAY
www.stanza.co.uk
|
|
|